
I will be sharing how to get started in R, using R-Studio. Most R blogs (see R bloggers) include a ‘getting started’ entry and this will be my first (autobigraphical) version of ‘getting started’, built around my answers to the question: Why use R?
I explain myself and, along the way, explain some key concepts, with examples.
Why use R? [getting started]
I was taught to use Minitab when an undergraduate; this was 20 years ago – so long ago, I am surprised to see it still exists (surprised because I have not seen it used since then by anyone I have ever worked with or by or for). As a graduate student and thereafter I learnt to use SPSS; there’s no need for a link because you will be using SPSS. I don’t use SPSS now. Why not?
I use R because I needed to complete mixed-effects analyses (see here for a widely cited (because it’s good) paper by Harald Baayen), tried to do this in SPSS (see here for a good how-to by Marc Brysbaert) and found that SPSS took hours to complete mixed-effects analyses for my not-too-large data-sets (from experiments on reading). Why use R? Answer [1]: I use R because it was faster than SPSS.
So, five years ago, I downloaded a copy of R and installed it. R is free to download and install, and this is another answer to the question: Why use R? Answer [2]: I use R because it is free.
Installation
How do you download and install R? Google “CRAN” and click on the download link, then follow the instructions (e.g. at “install R for the first time”).

Anthony Damico has produced some great video tutorials on using R, here is his how-to guide:
And moonheadsing at Learning Omics has got a blog post with a series of screen-shots showing you how to install R with pictures.
R being free is not a trivial feature. I do research in experimental psychology and there is currently a growing realization that in this and other fields we need to ‘show our workings’, that is, to ensure fellow scientists and other consumers of our research can see what we did to produce our observations; see this and other discussions of the question ‘Is there a crisis of confidence? [over research findings]’. We need to make our research reproducible, and one aspect of this requirement is that we share the raw data that goes into our analysis, as well as the analysis code we used to examine those data. If we do that, then others should be able to run that code to reproduce our results: this is easy, if the code is written in R, because R is free.
The command line
Having installed R, the first thing you do is go to the program menu where you’ll find it under newly installed programs. Click on the menu item ‘R’ and you get the console:
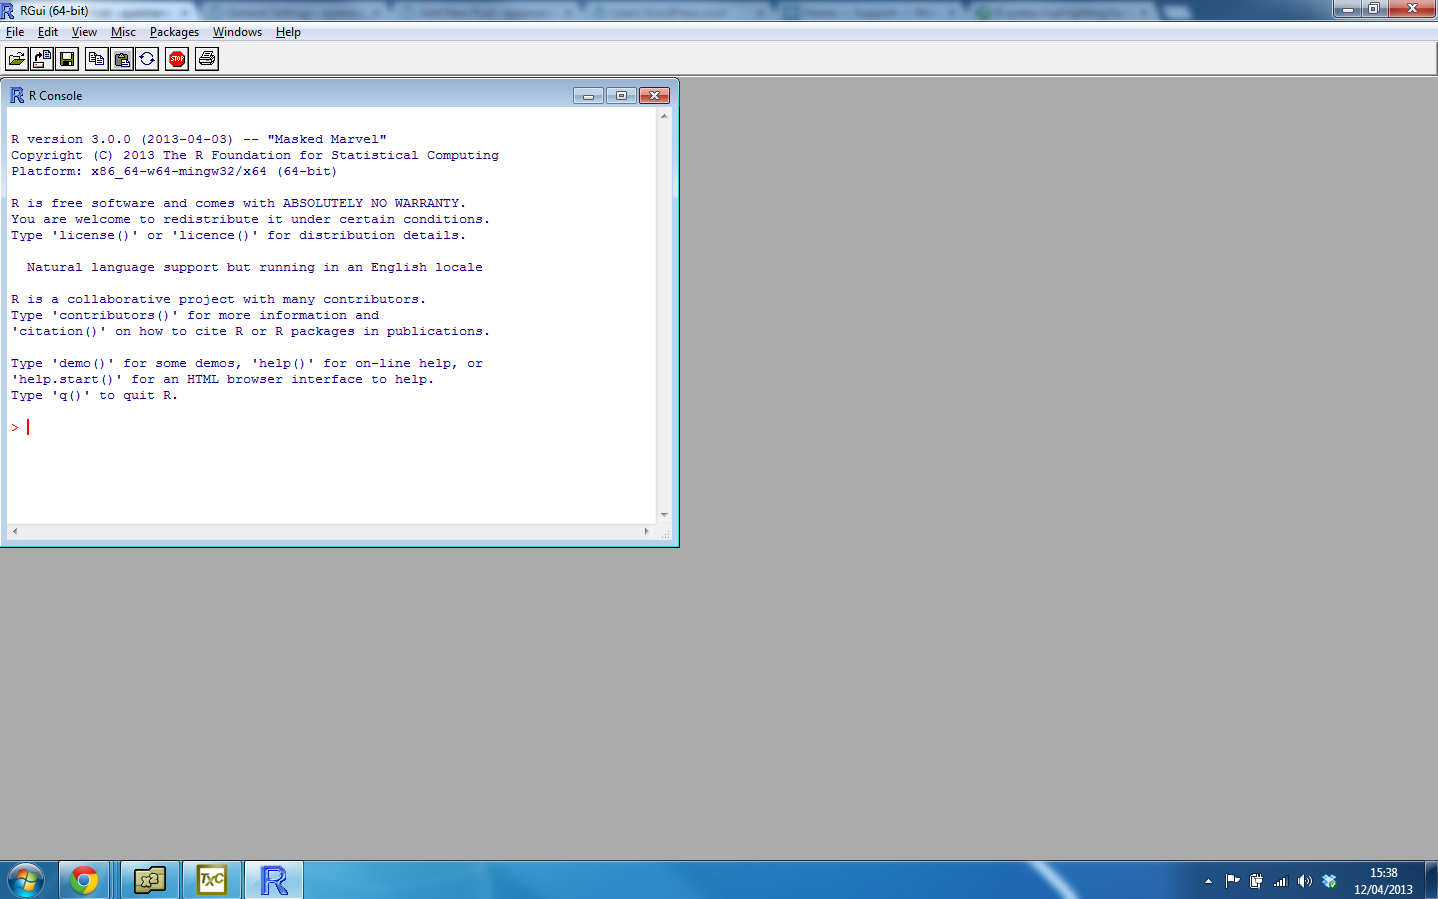
which is pretty intimidating if you are used to the ‘point and click’ face of programs like SPSS. (There’s an interesting discussion to be had about the ways in which we interact with computers.)
What do you see? Apparently, nothing but a bunch of information about the version, some menus that allow you to open or save files, copy or paste commands, install packages etc. but nothing that will allow you to do a test or an analysis
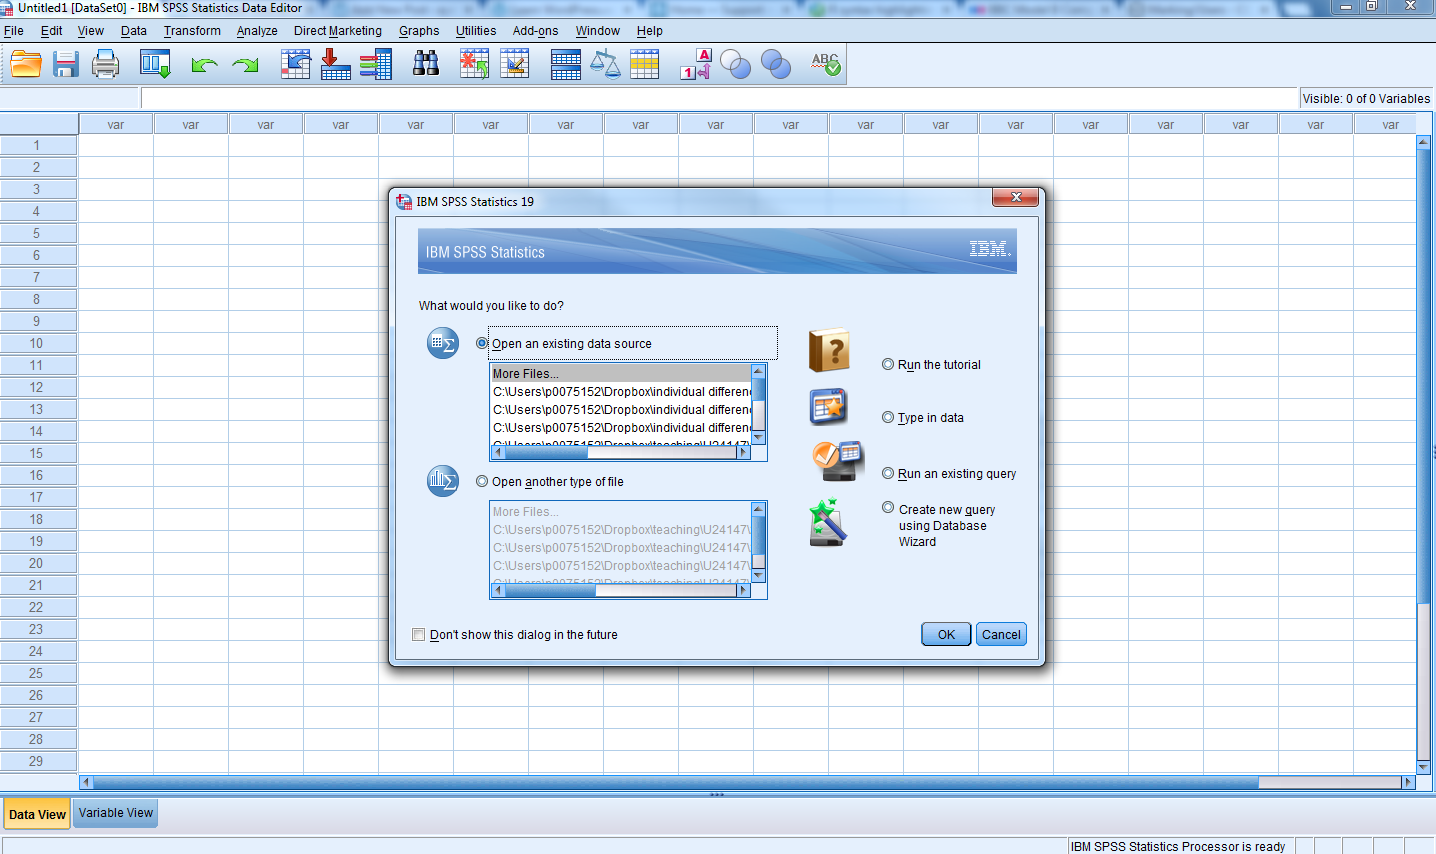
— nothing that (as SPSS does) asks you immediately: What would you like to do? Open a data file, do an analysis …
Nothing, that is, in the R console except the prompt:
>
Nothing will come of nothing unless you actually type a command. You need to interact with R as if you were engaging in a conversation with the computer, using language not mime.
It turned out that there is power in being able to interact with a computer through language. So, why use R? Answer [3] Using a language to perform analyses is flexible and thus powerful. Plus, I found that writing commands saves a huge amount of time compared to moving my hand round and round to point-and-click menu items thus: Why use R? Answer [4] I use less energy typing commands than using a mouse.
Still, that does not get away from the fact that when you start R nothing will happen unless you type a command.
> 1 + 2

# typing 1 + 2 at the > prompt, then typing enter to get the
# result of the calculation

[1] 3
At the start, you benefit from the experience of performing the simplest commands to use R as a big calculator: add +, subtract -, multiply *, divide /. This reassures you (it reassured me) that what I had installed is a working program that does things on command.
Note that if you type “#” R will ignore everything to the right of the hash symbol: this is how you comment on code.
The assignment arrow <-
The very next thing I did was to buy Harald Baayen’s book on doing statistics using R:
http://www.amazon.co.uk/Analyzing-Linguistic-Data-Introduction-Statistics/dp/0521709180
wherein I learnt immediately (p.1) that to get things done in R, one needs to install packages, to which we shall return, and that “The results of calculations can be saved and referenced by VARIABLES.” (p.3):
> x <- 1 + 2

# Break this down:
# x  -   I am creating a variable, x
# <- -   the assignment operator: I am assigning to x the results #        of the operation to the right
# 1 + 2  the operation is just the addition of 1 and 2
# What happens after you type this and press enter? Apparently,
# nothing happens.

> x
[1] 3

# To see what x now consists of, you need to type x and then enter

# What if we want to work with x?

> x + 1
[1] 4

# Why do we now see a result?
What is going on?
(See: http://cran.r-project.org/doc/manuals/r-release/R-intro.html – from which the following is paraphrased or copied outright.)
1. R is “…an environment within which many classical and modern statistical techniques are implemented.” In R, an analysis is done in a series of steps, with the results of intermediate steps stored as objects (like the x variable in the example). R will not show you the results unless you ask for them. SPSS will always show you all the results you (might but usually do not) want.
2. When you use R, it prompts you when it is waiting for a command, the default prompt is ‘>’.
3. “Technically R is an expression language with a very simple syntax. You write a command at the prompt, R executes the command – it interprets your language input – and then waits for another command.
4. “Elementary commands consist of either expressions or assignments. If an expression is given as a command, it is evaluated, printed (unless specifically made invisible), and the value is lost. An assignment also evaluates an expression and passes the value to a variable but the result is not automatically printed.”
— the ‘<-‘ in the example is an assignment
— in ‘x <- 1 + 2’ we are assigning the value of 1+2 to the variable (object) x
— just typing the command expression 1+2 — that expression is evaluated (interpreted or acted on), printed ‘[1]’ 3′ and the value is lost (no longer available to you in R’s working memory)
— by assigning the result of 1+2 to x, the result is stored as x but R will not print (show you) that result unless you type: x
The first day or so, all this was a bit stressful. SPSS is clunky, verbose and ugly but it always gave me something – switching mind-set to not getting something unless I asked for it was a little anxiety-provoking. I think that this is what contributes, in part, to the reputation that R has for being a language with ‘a steep learning curve’.
Writing scripts in editors or Integrated Development Environments (IDEs)
It was satisfying to get to the point, after a few hours, of being able to type in commands at the prompt, and get results back that showed R was working. But this style of interaction got boring quickly. I started writing the code (language text) to complete data analyses in a script, following examples in Baayen’s book.
[This is the best way to learn – choose this book or any other but do the examples. Skipping the examples will cost you later. Big time. If that sounds like you need to work to learn R, that is because you do. Tell me when anything worthwhile does not require work.]
This involves writing a series of commands in a text editor or IDE, and I started with Tinn-R:
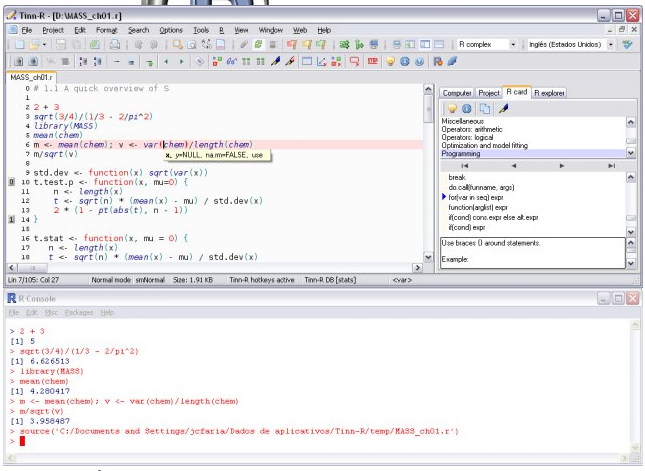
— you can see that there is the console, at the bottom, and another window with lines of commands (I am just going to call that code, from now on);
— what one does is to highlight the code that you want executed and then click on the run button, or green arrow (or whatever it is in whatever IDE you are using);
— but what I started to benefit from, and prize, was the fact that I could store this code, annotate it (using # lines), store it, copy and paste and reuse code, copy in code from other people …
— I learnt very quickly that if you have a problem in R, Google it and someone will have solved that problem, written up the solution together with the code, or the code edit you need, and shared it online.
This brings me to another major answer to the question, Why use R? Answer[5] Every problem I ever have has already been solved, and someone or something will tell me that answer.
Getting help
This point bears repeating: Every problem I ever have has already been solved, and someone or something will tell me that answer.
Have you ever tried using SPSS help? It is limited in scope and explanation, and, in some cases, arguably offers misleading statistically incorrect advice (see comments in R help by Bill Venables and others on the provision in SAS and SPSS of types of sums of squares in ANOVA). How do you get help in R or for using R?
[See Kabacoff: R in Action, p.11]
— in R console or in an IDE:
> help("foo")

# where "foo" is a place-holder for the name of whatever
# function you are interested in

# or

> ?foo

# or

> example("foo")

# examples of function

# or

> apropos("foo", mode = "function")

# list of available functions with <em>foo</em> in their name
— or do a Google search with keywords including: R, help, the function name
— or if you are getting an error message, copy and paste the whole text of the message into Google
There are a number of places online to find the information you need, nicely listed by Patrick Burns here:
http://www.r-bloggers.com/r-and-social-media/
and what you will find is that a Google search will frequently take you to an answer on Stackoverflow or one of the R help-list archives.
However, because it is sometimes difficult to even know what your problem is, I should say that I taught myself to use R with the help of the Baayen book and Rob Kabacoff’s website Quick-R
— now associated with an excellent book:
http://www.amazon.co.uk/Action-Data-Analysis-Graphics/dp/1935182390
–the website, back then, was a helpful guide to knowing what I wanted to do and finding the code that would allow me to do it.
What is the right answer?
At some point, you might say to yourself “There are many different answers to this question.” and you might ask yourself “Which is the right answer?” Well, if you’re confused and asking that question, you’re lucky because you’re experiencing the opportunity to deepen your understanding. I sometimes teach statistics or research methods in classes or workshops with a demonstrator also present, and, occasionally, a student will ask both me and the demonstrator the same question and we will give results that may differ in wording, in the details of the approach we recommend to address the question or, even, in the concepts we use to frame the question or our answer to it. This variation very often worries or angers students. I think people would prefer to know that there is a single correct answer to their question and then that they be given that answer. This is how maths classes work in school. It is not really how things work in further or higher education, nor should it be. Very often, the analysis you perform, in substance (what test do I use?) or in detail (what variation of the test?) is a choice you have to make as a matter of your understanding of the problem. If you do not understand the problem, or do not understand the potential solutions to that problem, or both, then it is hard to make the appropriate choice, or it is hard to feel that you have made the appropriate choice. If you’re worried, what should you do?
Using SPSS makes things easy, to some extent, by offering a menu of choices that restrict the choosing you have to do. Also, the way statistics is often taught makes things easy by giving you a series of decision points (Are the data like this? If yes, then do A, if no, then do B) i.e. it is taught to allow you to avoid having to develop your understanding so that you can make a choice without understanding it. I ask you: is that really the right way to operate?
If you are worried if you have made the right choice, what you need to do is research that choice, seek to understand your problem, seek to understand the options you have in the differing ways you can approach your problem, test out the adequacy of differing solutions, make a choice, and live with that choice. So this supplies a further answer to the question, Why use R? Answer [6] I use R because I learn more about what I am doing through being required to think more about it.
Packages and functions, and R being a language
http://cran.r-project.org/doc/manuals/r-release/R-intro.html
R is an environment: “R is an integrated suite of software facilities for data manipulation, calculation and graphical display.”
You can program a data analysis in R (actually, in the S language) or you can use programs written by other people, written in S or other languages (NB I am going to refer to the language as R from now on, to save confusion).
The basic R installation – what you start with, what you installed at first – comes with considerable capacity (many tools, many programs) built-in. However, R is expanding very rapidly because new capacities are being added all the time. This brings me to a further answer to the question, Why use R? Answer [7] I use R because it is useful and convenient to be using a tool that is very popular and increasingly capable.
[See Dalgaard, Introductory statistics with R, chptr.1; see
http://www.amazon.co.uk/Introductory-Statistics-R-Computing/dp/0387790535]
[D.p.9] — “The basic interaction mode in R is one of expression evaluation.” We already saw this in
> x <- 1 + 2
[1] 3

> x + 1
[1] 4
— where an example of an expressions is:
> x <- 1 + 2

# assign the value of 1+2 to the variable x
[D.p.9] — “Many things in R are done using function calls, commands that look like an application of a mathematical function of one or several variables; for example log(x) …” Let’s try calling (asking to use) the function log():
> log(x)
[1] 1.098612
Think of a function as an action. Writing code with a function call is like writing a sentence with a verb in it. Think of this:
> y <- log(x)
— as a sentence.
— In English, a sentence has a subject, a verb and an object, e.g. “Man bites dog.” where the subject (man) does something (bites) to the object (dog).
— Similarly, the code y <- log(x) can be understood as a sentence of a language with a different way of arranging things (a different syntax) but similar elements: <- log() is the action; x is the thing being acted on, and y is the result of the action. Try it out, write the sentence, then ask for the result:
> y <- log(x)
> y

[1] 1.098612
[D.p.11] — “The format is that a function name is followed by a set of parentheses containing one or more arguments.” In log(x) the argument is x. Many functions in R have many possible arguments, and you can choose to specify values for the arguments, or allow the default values to be used: arguments can be used to set the details for how a function works. This can complicate things but generally in a good way. I mean: whereas in SPSS you learn how to work as if you were going to a foreign country and needed to order food in a restaurant and opted not to learn the verbs and the nouns and the grammar but just memorized key words from flashcards; in R, you are learning how to speak the language of the new country (data analysis-land). This is another nice two-torial, on functions:
In R, functions are provided in the packages that come with the stock installation. You can also install packages of functions provided by other people.
[D.p.35] “An R installation contains one or more libraries of packages.”
— a library is a folder on your disk
— a package can contain functions written in R, libraries of code, and data — it implements a functionality that may not be needed all the time
— package is loaded into R using the library command, e.g. to load the ggplot2 package:
> library(ggplot2)
— and the library() function call makes the functions and data associated with ggplot2 available for use – they are not available if you have not run this command.
This is the two-torial on how to download and install packages in R:
Popularity
Robert Muenchen provides a thorough analysis of the growth in popularity of R, an analysis showing that it is very popular because it is widely discussed, widely blogged about, most popular in data analysis and data mining competitions, and increasingly cited in scholarly research. Note that the analysis shows R is mentioned in job adverts but not as often as SAS, SPSS or Minitab, though in the academic (Psychology) area, I have seen my graduate students advantaged by presenting skills in both SPSS and R. The killer facts for me, though, are that R is used in the in-house data analysis operations of companies that are serious about data analysis (a kind of external validation by money) and by an accelerating (already large) number of researchers.
1. Companies like Google use R (and really should know what they are doing), as witness their production of an R style guide:
http://google-styleguide.googlecode.com/svn/trunk/google-r-style.html
— and I’d love to work for Google, well, you never know.
— see also these quotes from scientists working at Google:
http://www.sr.bham.ac.uk/~ajrs/R/why_R.html
2. Using R gives me access to a vast and growing capacity to make sense of my data:

Robert Muenchen, fig10: number of R packages available at each major release http://r4stats.com/articles/popularity/
— this is a capacity, and a growth, that dwarfs that for all other statistical software. This surely adds another answer to the question, Why use R? Answer [8] I use R because it is here to stay and may well dominate the future of data analysis.
The graphical capacities are the best
In other software applications – e.g. Excel, SPSS – how you visualize your data is limited to a set of options provided by the application authors and, universally, these are options with ugly results. In R, you need to ask not “What can I do in Excel or SPSS?” but “What do I need to examine these data, to tell the story of my findings?” Using R gives me the capacity to draw amazing, insightful, visualization of my data. A wonderful example of R’s capacities can be seen here:
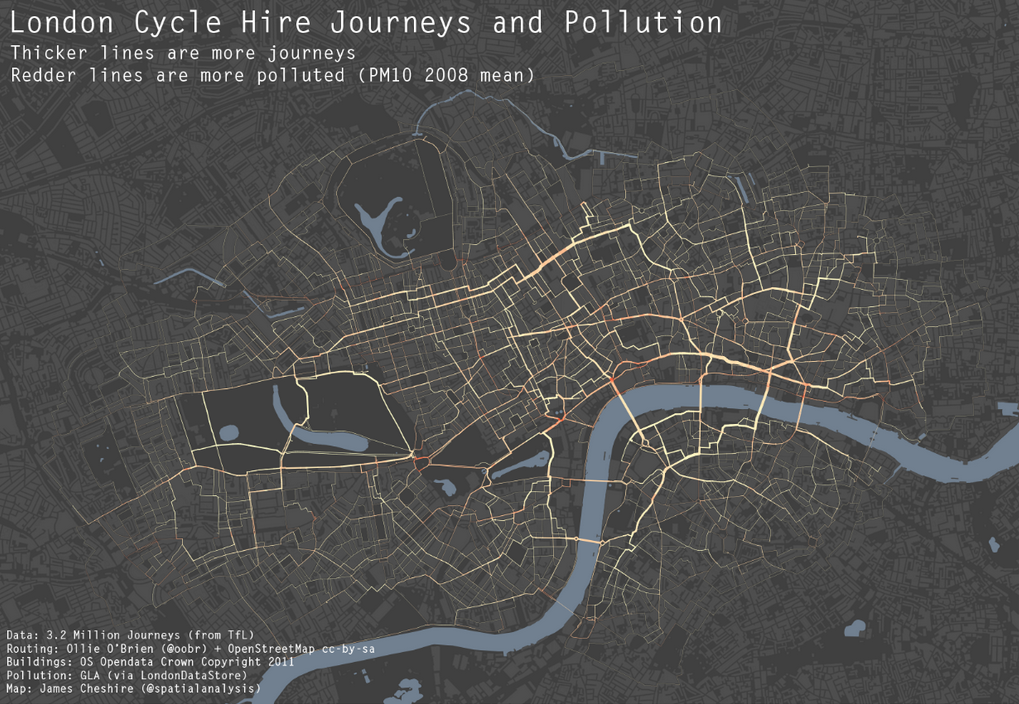
James Cheshire: http://spatialanalysis.co.uk/wp-content/uploads/2012/02/bike_pollution_web.png h/t R-Bloggers
— and (famously) here:

Paul Butler: visualizing friendships on Facebook – http://www.facebook.com/note.php?note_id=469716398919
— and (regularly) here (in the NYT):

Bloch et al., NYT, 2009 – How Michael Jackson’s Billboard Rankings Compare With Other Notable Artists
http://www.nytimes.com/interactive/2009/06/25/arts/0625-jackson-graphic.html
NB interesting insights into how the NYT team uses R can be found here, here, here and here.
— and (not famously) here:
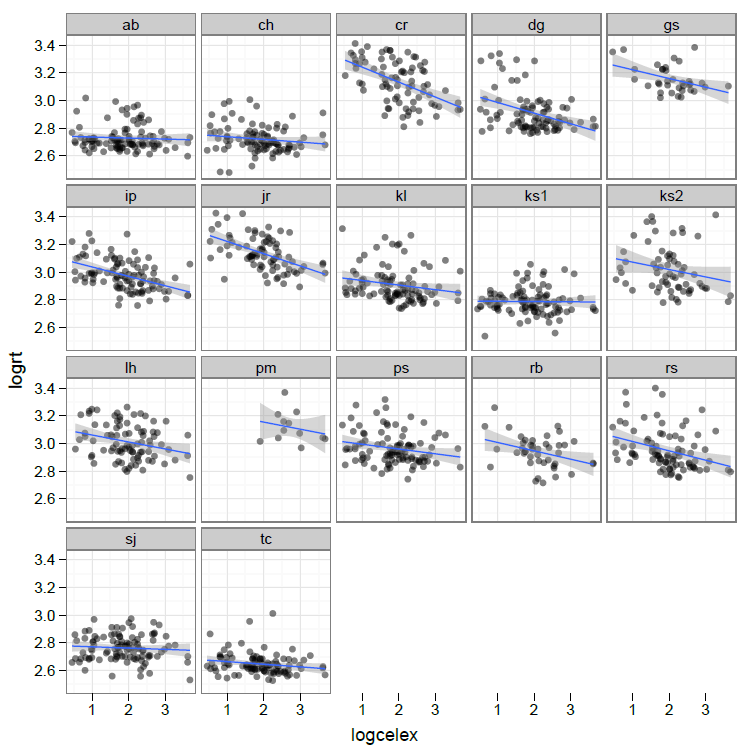
— This is the first plot of my data I was really please by, on grounds of both utility and aesthetic pleasure. The plot shows a trellis of scatterplots depicting the effect of frequency on word naming RT, separately for each individual in a sample of adult learners of literacy. The plot is useful because it shows the substantial variation in the effect between individuals. It is aesthetically pleasing to me because it shows complexity (the effect of frequency on reading performance varies between individuals) simple i.e. it is elegant. It is no accident that the plot was drawn using the R ggplot2 package of functions, and that ggplot2 book is subtitled “Elegant graphics for Data Analysis”:
http://www.amazon.co.uk/ggplot2-Elegant-Graphics-Data-Analysis/dp/0387981403
— The trellis of scatterplots I have done here can be accomplished in different ways in R.
— In ggplot2, I used facetting, but the detail of presentation also involved modulation of point opacity (to avoid overplotting), and the presentation of (monotonic) linear regression line of best fit with the addition of shading to show confidence intervals; see a tutorial here on gettinggeneticsdone h/t R Bloggers.
Why use R? Answer [9] I use R because I like looking at beautiful things and in R I can make my graphs beautiful things that I can like to look at (why not)?
Summary: Why use R? [getting started]
1. Because it was faster than SPSS [in doing mixed-effects analyses].
2. Because it is free.
3. Using a language to perform analyses is flexible and thus powerful.
4. I use less energy typing commands than using a mouse.
5. Every problem I ever have has already been solved, and someone or something will tell me that answer.
6. I learn more about what I am doing through being required to think more about it.
7. It is useful and convenient to be using a tool that is very popular and increasingly capable.
8. R is here to stay and may well dominate the future of data analysis.
9. I like looking at beautiful things and in R I can make my graphs beautiful things that I can like to look at (why not)?

