
As we get started, we will need help, let’s work on how and where to find that help, and also how to act on it.
We will need help in various ways when using R
You need help most of the time when using a software programme, but if you’re getting started on R you don’t have the advantage of practice that you have with MS Word or Excel or SPSS. Needing help is not an R thing, it’s a learning thing. However, there being lots of help available is an R thing.
In the following, I’ll discuss two common (for me) help scenarios:
1. Let’s say you are trying to run a line of code and you get an error message or a warning
2. We will need help where we’ve got a decision to make
— The first is usually when I a trying to do something and I have a specific problem I need help on.
— The second is when I am not really sure what I need or even if I need help.
I’ll talk about getting advice and also dealing with it.
1. Let’s say you are trying to run a line of code and you get an error message or a warning
R is a case-sensitive, interpreted language.
– This means that if you spell an object name incorrectly, if you get the syntax wrong, if you muddle letter case, you will get an error (just like any natural language).
The error messages can be cryptic.
For example, I run the following (incorrect) line of code:
p <- ggplot(mtcars, aes(x = wt))
p + geom_Object)
I get this:
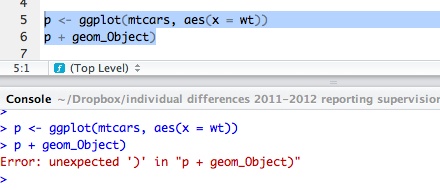
— You can see in the message that the (first) problem is the bracket is wrong.
How do I work out what to do?
First, more than likely, I am trying something out but I have beside me a book or a website I am working from, maybe trying an example: so if I got a message like this I would check that I copied the code correctly.
Second, I might try to google the error message “Error: unexpected ‘)’ in “p + geom_Object)” — try it — it does not get me very far in this case.
Third, I try to change the code to see what difference that makes. Here, the problem is with the bracket so I change that:
p <- ggplot(mtcars, aes(x = wt))
p + geom_Object()
— The obvious response to the error message was to close the brackets — even minimal experience with R will tell you that open brackets are not doing much good.
— Sometimes, that quick response will solve the problem straightaway.
— Sometimes it won’t and you might get another message, like this:

— “could not find function” — so obviously, I am still not getting the function name right — actually, I get the case wrong.
— But let’s say I am convinced I have it right: what should I do?
— Google it — most of the time, reasonably careful reading of the result will tell you what’s going on.
How and where to find help
As noted previously, there are plenty of places to get help, see also following, but one place you should know to look in is the built-in R help.
So you’re trying to work out how to use a function, or you’re looking for a function, or you’re trying to work out what options to use with a function, you can use in-built help:
– type: ?[name of function] or help([name of function]) or ??[name of function]
–Where [name of function] from [ to ] inclusive is the name of the function you want help with, for example, if you entered the function call:
help(ggplot)
in the RStudio script window and then ran that command you would get this:

— Notice that you get the help(ggplot) command being shown in the console in blue, it has been executed, but the result appears on the right, in the Help window.
The built-in help in R, accessed by running a help([function name) or ?[function name] command, has a standard structure, it is useful but not (I admit) always terribly friendly. I usually use it if I basically know what the function is for and why I am using it but I want to use the function in a specific way or a different way than default.
The help will tell you: 1. what the function does 2. what arguments can be passed to it to work 3. how it can be specified in various ways; and 4. it will give you some example code to try out. The example code will work with built-in data and usually, I learn the most by playing with the example.
Note that a google search in a form something like this: “in R [name of function or text of error message]” will very often take you to a post on stackoverflow or some R blog where the error or problem and the solution or multiple alternate solutions (this is R) will be described or explained for you.
What to do with the help
Try it out. Learning how to use R involves some experimentation. Copy the code from a reported solution into a script, try running it and see if it works.
Every problem you ever have will already have been solved by someone else and, in R, the solution will be reported online.
2. We will need help where we’ve got a decision to make
Most modern software applications strive to ensure we get what we want without thinking too much about either the ends or the means. An application might, as soon as we start it, ask us what we want or show us what we might want: to write a letter; to input data; to read our emails. In R, you’re the boss of you and with power comes responsibility.
We might need help, in R, to work out what we want — Case one: You have a vague idea about what you are doing
Most applications will give you one way to do any thing. In R, you will usually have more than one (often, several) different ways to do a thing.
– Which way do you choose? This is a decision based on (for me) answers to the questions: does it work (now)? do I understand why it works? do I like it?
Typically, I work out what I want in one of three ways:
1. I am reading a book e.g. “R in Action” by Kabacoff on a topic relevant to my current task, e.g. on how to manipulate the structure of a dataframe, and I see a description of something I need to do, so I follow the example (code is given, operating on built-in data) and then adapt the code (e.g. changing variable names) to do that action for my own data.
2. I have only a vague idea of what I want, let’s say I am vaguely thinking that I would like to be able to draw error bars in R, so I enter the following in google: “How do I draw error bars in R” and I will get a result that looks like this:
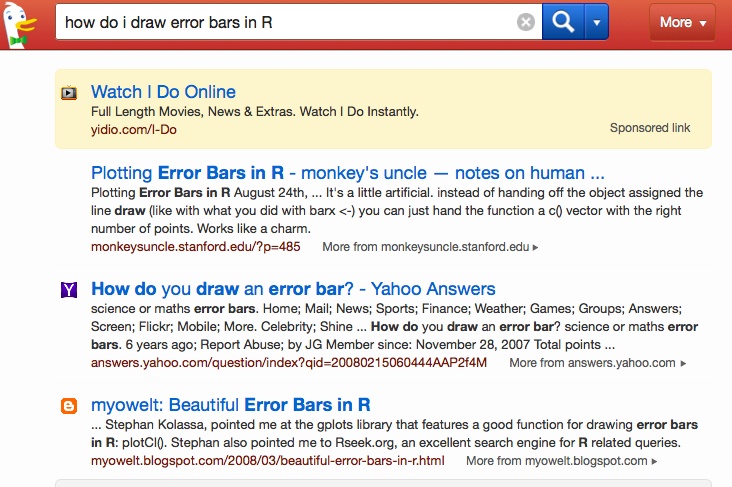
I use DuckDuckGo instead of Google but the result will be similar whatever your search engine.
Typing a description of a problem or a question will often bring up a lot of results so I look for whatever seems promising, start reading it and then if I can understand the advice, and think I like the look of the results, I copy the code (code is always provided) to try the suggested solution.
Note you sometimes get alternate solutions getting offered in the comments.
Half the time, the search will give me a result listing linked to a discussion in Stack Overflow like this result in response to the question: “How can I break line on R’s setwd() command?”
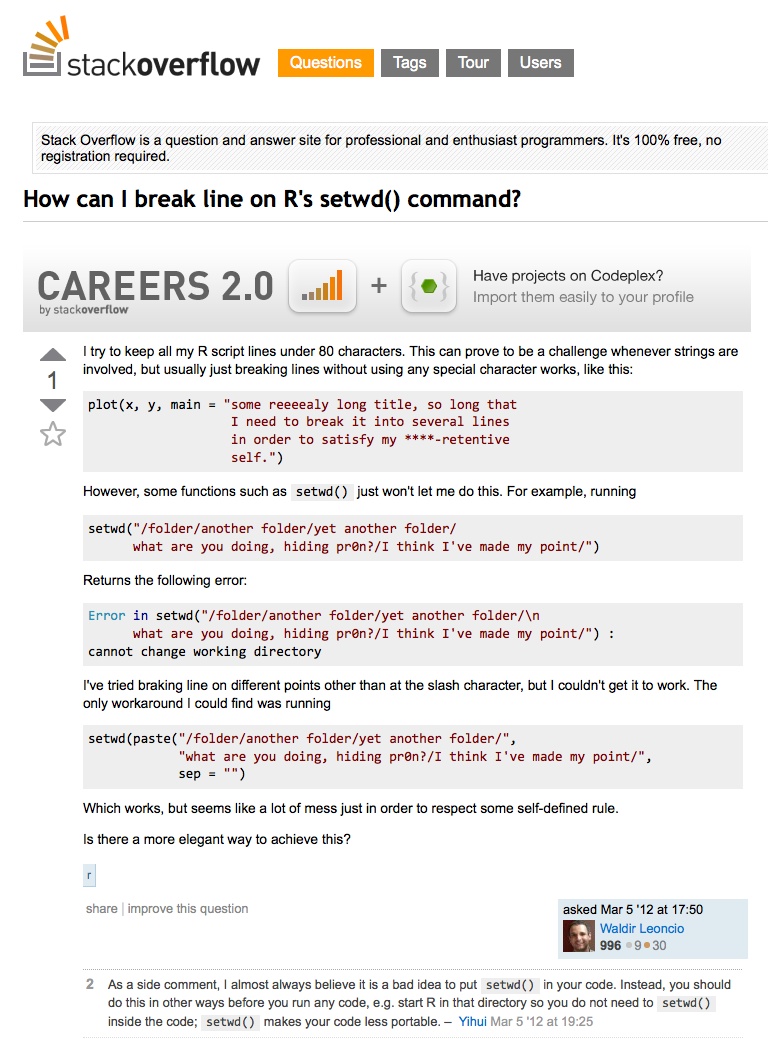
— This discussion was posted to StackOverflow in response to the question. You can see that one of the commentators did not think the person asking the question should even be using setwd(). While another commentator did think setwd() was useful. I agree with the second, but I note this to indicate that there is plenty of discussion, and often alternate solutions, for any one question you might have.
We might need help, in R, to work out what we want — Case two: I am not really aware that I have a problem but I am feeling dissatisfied with the approach I am currently taking
For example, I sometimes need to analyse information ordered by date and I am presenting it how I usually do with a bar chart or a line graph or something but I just don’t think the product feels right. What I might do, and what I used to do a lot, is have a look around for inspiration among the various R online aggregations of advice and tips.
For example, see what is shown at the R graph gallery website. There, if I were following my hypothetical example, I might find this:
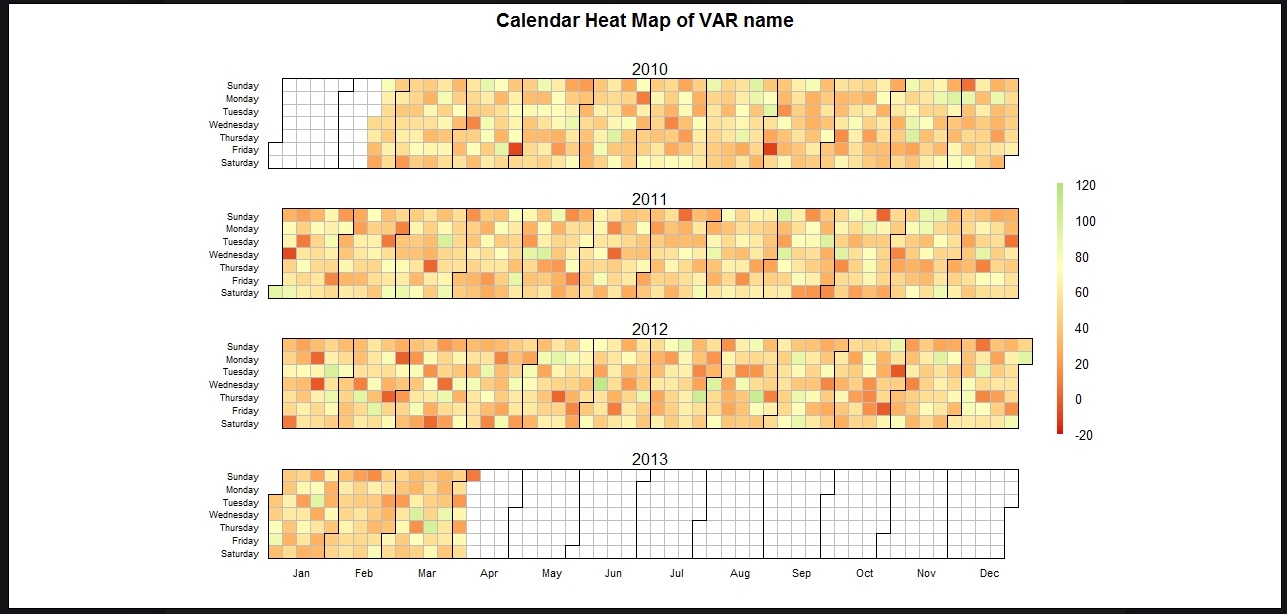
A calendar heat map
— which looks pretty cool, and of course comes with a code example you can try out.
Or I might have a look around the R-bloggers website, and see if anything nice looking has been posted lately, like this:

— coincidentally, a post by Max Gordon on a topic I was disussing yesterday: how can I produce a complete article, tabled statistics and text from inside R?
What have we learnt?
You will need help in R, but there is a lot of it and you can just work on how and where to find it, then what to do with it.
